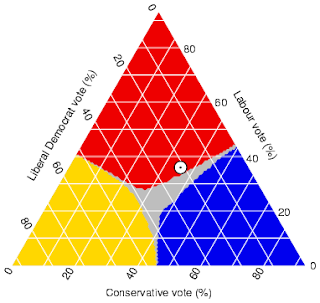
Triangular plots depict the way three variables interact with eachother. This is often used in geology as a way to show the way three different types of rocks can combine. The map to the right shows the ways in which political demographics were split
Subscribe to:
Post Comments (Atom)


0 comments:
Post a Comment