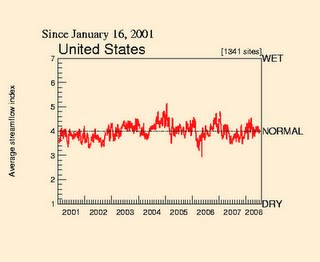
Index value plots show differences between points of data. This is very similar to a line plot, but instead the lines are closer together. You see these types of map showing seasonal changes in environmental maps.
Subscribe to:
Post Comments (Atom)


0 comments:
Post a Comment