Bilateral Graph

9:56 AM / Posted by tenorchick / comments (0)


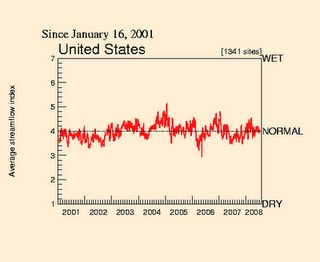
Bilateral graphs depict two or more variables. They show this in much the same way as a bar graph or line graphs.


Triangular Plot

9:52 AM / Posted by tenorchick / comments (0)


Triangular plots depict the way three variables interact with eachother. This is often used in geology as a way to show the way three different types of rocks can combine. The map to the right shows the ways in which political demographics were split


Climographs

9:48 AM / Posted by tenorchick / comments (0)


Climographs show the average monthly amounts of precipitation and correlating temperatures. This map of Hawaii shows and average temperature of around 70-80 degrees year round while precipitation changes with seasons


Windrose

9:44 AM / Posted by tenorchick / comments (0)


Windrose incorporate a rose compass overlain with the direction and power of winds. This is used most often by meteorologists to predict and study weather.


Parralel Coordinate Graph

9:40 AM / Posted by tenorchick / comments (0)


Parralel coordinate graphs are perhaps the most difficult and complex graphs within this catalogue. Parralel graphs depict multivariabled data, with each point having its own y/x axis with lines connection each observation between variables.


Population Profile

9:37 AM / Posted by tenorchick / comments (0)


Population profiles show the change in population by age. This is done through the use of a census.
In this profile you can see that while there is a greater number of younger males then females, females outnumber males later in life.

Scatterplot

9:34 AM / Posted by tenorchick / comments (0)


Scatterplots show correlating data by the placement of dots. This map shows the correlation of the ages of wife and husband.


Index Value Plot

9:27 AM / Posted by tenorchick / comments (0)


Index value plots show differences between points of data. This is very similar to a line plot, but instead the lines are closer together. You see these types of map showing seasonal changes in environmental maps.


Propoganda Map

9:20 AM / Posted by tenorchick / comments (0)


Propoganda maps are not true maps. While they map have the same general shape (although not often) they are often distorted to show different views of an idea.


Box Plot

9:17 AM / Posted by tenorchick / comments (0)


Box plots compare data by size of the box. While box plots are good for comparing a generally large number to smaller numbers they are not as concise in numerical data as other maps.


Histogram

9:07 AM / Posted by tenorchick / comments (0)


Histograms show frequencies of the occurence of data. This is very similar to the way a bar graph expresses data.


Similarity matrix

8:47 AM / Posted by tenorchick / comments (0)


A similarity matrix is similar to a correlation matrix. Instead of using many values and portraying those closest in correlation, a similarity matrix depicts two values and how they are similar.


Correlation Matrix

8:42 AM / Posted by tenorchick / comments (0)


Correlation matrix maps take large amounts of data and combine them in a square chart. The values that are most correlated to each other are closest and usually shown by similar color rangeds.


Stem and Leaf Plot

8:38 AM / Posted by tenorchick / comments (0)


Stem and leaf plots are bes for showing numerical values. By placing the greatest 10s place of the value in the stem of the plot, you can add the smaller value to the other side. So instead of writing out a bunch of numbers, this plot looks a lot more organized.


Star Plot

3:11 PM / Posted by tenorchick / comments (0)


Star plots show information in a way similar to pie charts. But instead think of it as a bike tire on which you can wrap strings around to show the proportional amount of data.


Unstandardized Choropleth

3:02 PM / Posted by tenorchick / comments (0)


Unstandardized choropleth maps are maps that have not been areally averaged. this map shows water withdrawal.


Standardized Choropleth

2:48 PM / Posted by tenorchick / comments (0)


Standardarzed choropleth maps are used to compare variable data in the form of distribution. This map shows the population percentage of people 14 and under in Canada


Univariate Chrorpleth

3:13 PM / Posted by tenorchick / comments (0)


Univariate maps, like the name suggest, show only one variable on the map. This map shows the result for the 2004 Presidential election

Bivariate Choropleth

2:40 PM / Posted by tenorchick / comments (0)


Bivariate maps are choropleth maps showing TWO different variables on the same map using different symbols. These are best for contrasting variables.


Unclassed Choropleth

2:24 PM / Posted by tenorchick / comments (0)


Unclassed choropleth maps are similar to classed but are a much bigger scale. Because the scale is much bigger numbers on unclassed maps the numbers depicted by the map are much less acurate. Unclassed maps have not been aerially averaged.


Classed Choropleth

2:02 PM / Posted by tenorchick / comments (0)


Classed choropleth maps show areal units that are combined into smaller numbers of groups. These smaller groups can be counties or cities.


Continuously Variable Proportional Circle

11:36 AM / Posted by tenorchick / comments (0)


These maps use variable sized circles to show amount of data direction proportion to the size of the circle. These maps are great for a specific scale.


DOQQ

11:22 AM / Posted by tenorchick / comments (0)


Digital orthoquarter quads are forms of aerial photos. Part of the raster mapping family, they can also be forms of color infared maps.


DEM

10:53 AM / Posted by tenorchick / comments (0)


DEM or digital elevation model are most often 3d representations of ground terrain or shaded relief maps. They are a type of topography map, showing the lay of the land.


DLG

10:49 AM / Posted by tenorchick / comments (0)


Digital line graphs combine planimetric and vector maps. They're very often used by the USGS, United States Geological Service to view roads, rivers, along with boundaries


DRG

9:45 AM / Posted by tenorchick / comments (0)


A DRG is a digital raster graphic map. It is basically a scan of a topographic map with lats and longs lines.


Isopleth Map

9:27 AM / Posted by tenorchick / comments (0)


Isopleth maps are a type of thematic map. They show continuous lines that connect points of equal value. These values can be anywhere from temperature to rainfall, etc.


Isopach Map

9:24 AM / Posted by tenorchick / comments (0)


Isopach maps show the vertical thickness of rock. This is especially useful for mining and drilling.


Isohyet Map

9:20 AM / Posted by tenorchick / comments (0)


Isohyet maps show areas with equal amount of rainfall and precipitation. This is shown over a period of time of months or a year.


Isotach

8:51 AM / Posted by tenorchick / comments (0)


Isotach maps show areas of equal wind speed.
The area darkest in color is the area with the highest wind speed

Isobar Map

8:12 AM / Posted by tenorchick / comments (0)


Isobar maps are a type of weather forecasting map. The isobars show areas of same atmospheric pressure and also show areas of high and low pressure.


LIDAR

8:08 AM / Posted by tenorchick / comments (0)


LIDAR or light detection and ranging uses laser pulses to determine information such as distance and range of a specific target. Information such as distance is determined in much the same way as echolocation, measuring the time it takes for the laser pulses to bounce and return. This is a LIDAR map of Manhatten.


Dopplar Radar

8:00 AM / Posted by tenorchick / comments (0)


Dopplar radar is used primarily in showing weather patterns over a certain area. This is especially useful in the forecasting of hurricanes over a large area. We know this very well because of the large amounts of hurricanes to pass through Florida.


Black and White Aerial

7:38 AM / Posted by tenorchick / comments (0)


Black and white aerial photography is used to see the basic layout of the land. The darker vegetation and come up black while cities and urban areas you can see the layout much easier.


Infared Aerial Phote

7:26 AM / Posted by tenorchick / comments (0)


Infared aerial photos are used mostly to view vegatation and changes therein. In a way this is kind of a chloropleth map because it uses variations in color to signify changes. this is especially used to signify the amount of change global warming has had on forest vegetation.

Cartographic Animation

7:15 PM / Posted by tenorchick / comments (0)

When I think of cartographic animation i think of the animations
of hurricanes. We see these all the time when watching the news
and weather channel. Also see my chloropleth for another example.

map url-

Statistical map

7:04 PM / Posted by tenorchick / comments (0)


Statistical maps show the variation in the data. This is very similar to thematic, dot distribution, and chloropleth maps.


Cartograms

7:00 PM / Posted by tenorchick / comments (0)


Cartograms are a type of thematic map, with one twist. While showing differences in the mapping variable by different colors, it also distorts the map to show the size of the mapping variable compared to the land.


Flow Maps

6:47 PM / Posted by tenorchick / comments (0)


Flow maps often show the movement of something from one location to another. This can be anything from population to the selling of goods.


Dot Distribution Map

6:40 PM / Posted by tenorchick / comments (0)


Dot distribution maps are best in showing changes in number data across a map. This map shows the number of metropolitan poor, mostly isolated on the east coast.

Isoline Maps

6:22 PM / Posted by tenorchick / comments (0)


Isoline maps show areas with equal numbers through the use of continuous lines. Eamples would be temperature, barometric pressure, and altitude.


Proportional Circle

5:45 PM / Posted by tenorchick / comments (0)

Proportional circle maps show data as a relation of size to number. The larger the size of the circle, the number should be that large in proportion

map url-
http://personal.frostburg.edu/krtopping0/maps.htm

Chloropleth Map

5:32 PM / Posted by tenorchick / comments (1)

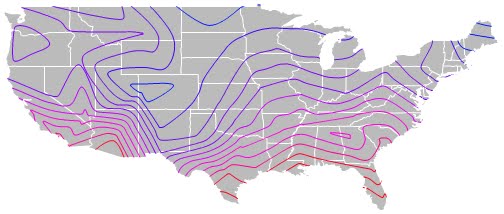
Chloropleth maps are maps that show differences in
values using shading, coloing or patterns. In this way they are very similar to hypsometric maps (which shade according to elevation)

map url-
http://www.pop.psu.edu/gia-core/divorce.htm


Hypsometric Map

7:36 PM / Posted by tenorchick / comments (0)

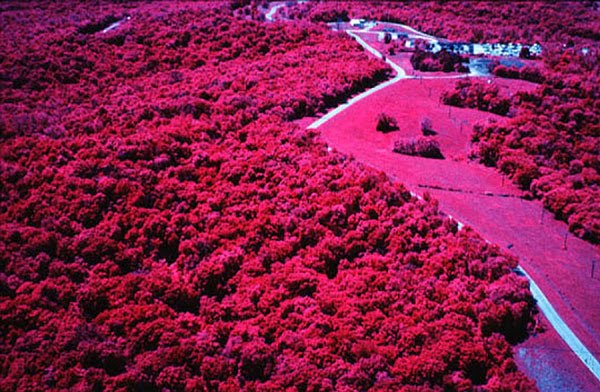
Hypsometric maps are in essence just topographical maps. But the difference between the two is the shading that is often seen on hypsometric maps to signify the different changes in contours. I picked this map because, well, quite frankly, it was a beautiful map, very pleasing to the eyes.

map url-


http://www.earthexplorer.com/2009-03/Subsurface_Geology_Challenges_Goiania_Metro.asp

PLSS Map

7:10 PM / Posted by tenorchick / comments (0)

PLSS or public land survey maps are used to map out land parcels mostly in rural areas, often mass farming land. PLSS is often counted in parcels, sections and townships. As you can see in this map, the larger parcels of land correspond rather closely to lines of latitude and longitude.

map url- http://forum.delorme.com/viewtopic.php?p=81273

Cadastral Map

6:23 PM / Posted by tenorchick / comments (0)

Cadastral maps show boundaries and ownership of land. This map contains the boundaries for neighborhoods, blocks and land parcels from the Kuwait Municipality Survey Department. notice the precision of the layout, precise lines to show boundaries. This is something you need when determining boundaries. People will fight for every centimeter of land they think is theirs


map url- http://www.gisdevelopment.net/technology/gis/me05_137.htm

Thematic Map

6:16 PM / Posted by tenorchick / comments (0)

Thematic maps as the title says are based on themes, such as population density, wealth, vegetation and in this case water use. this map, in addition to being a thematic map, is also a chloropleth map because of the differently shaded areas.


map url- http://en.wikipedia.org/wiki/Thematic_map

Topographic Map

4:18 PM / Posted by tenorchick / comments (0)


Topographic maps are my favorite maps to read.
I actually have started a small collection of these
maps as well. Topographic maps show relief and
changes in elevation from sea level.

Planimetric Map

11:24 AM / Posted by tenorchick / comments (0)

This map is considered Planimetric because it doesn't take into account the verticle aspects of the location. Instead this is a map of the horizantal aspects.